
Costs & Benefits from improved roads
Home » Costs & Benefits from improved roads

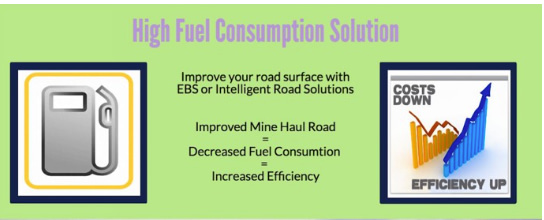
“Mine production is strictly linked to the quality of haul roads considering they determine the cycle time of trucks along the haul roads and the accessibility of loading and dumping areas.”
“Investing in building good haul roads guarantees mining equipment will reach the required speed in a safer manner.”
*Taken from the article entitled “In for The Long Haul” Mining Mirror Magazine Volume 25 No. 10 April 2013
“Any savings generated from improved road design and management will benefit the mining company directly as a
reduced cost per ton material hauled.”
*Taken from the paper entitled “Integrated Asset Management Strategies for Unpaved Mine Haul Roads” written by Roger J Thompson and Alex T Visser
of the University of Pretoria
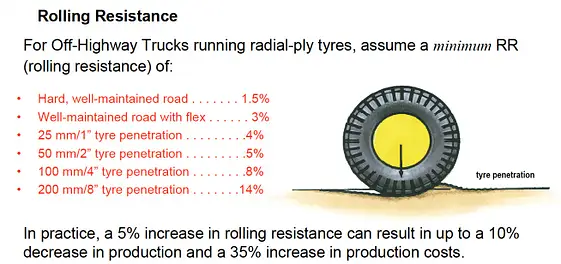

Additional — an improved road surface improves rolling resistance — according to the CAT handbook using a CAT 777D – a medium reduction in Rolling Resistance will result in a reduction in fuel consumption of 18.75 litres per hour / per vehicle.
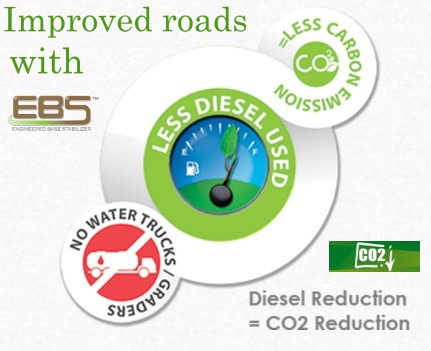
For further information regarding our gravel road, mine haul road and environmental solutions please click on the following links:
Actual Cost & Benefit Case Studies
- 1. Mine Access & Pit Road Project
- 21 km x 30m
Application of EBS Surface Seal on Access Roads and Haul Roads
COST SAVINGS…
$ 1 Year Savings = US$ 1.4 Million
$ 10 Year Savings = US$ 27.2 Million
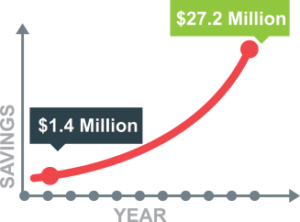
- The 10 year life cycle cost benefits are based on the fact that once our products are applied the requirement for all remediation work is eliminated including watering, grading and importation and placing of additional road material.
WATER
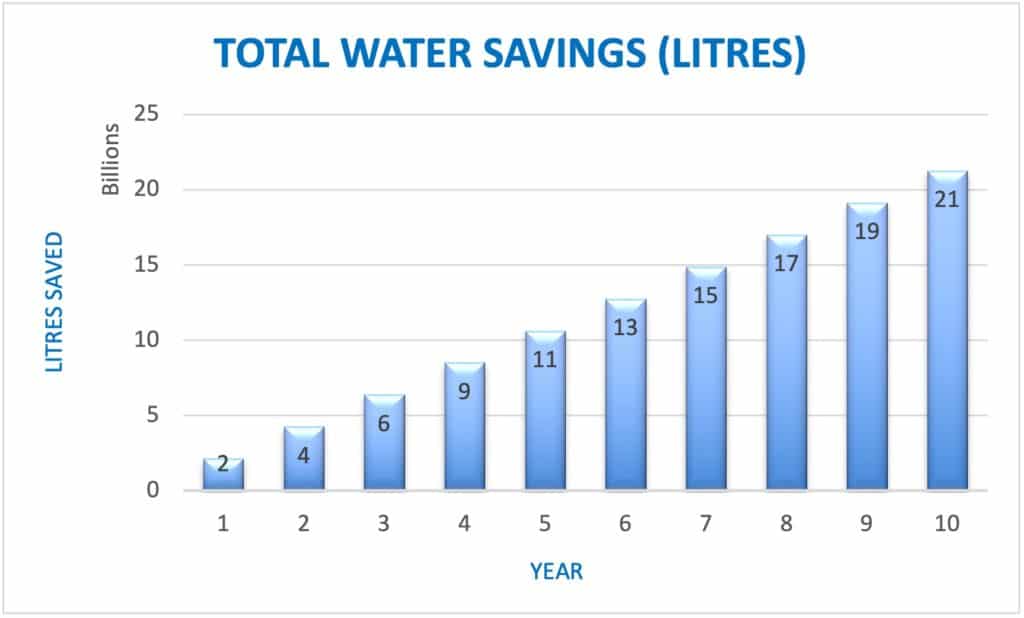
The water use per day was 416,350 litres x 14 trips per day using 4 CAT 785D water trucks applying a total of 5,828,900 litres per day
- Water saved in 1 Year:
2.1 billion litres
- Water saved in 10 Years: 21 billion litres
- Contact us to see if you qualify for a free Cost & Benefit Analysis Report. The above information is general, our reports will provide quantifiable amounts and detailed recommendations.
- 2. Mine Haul Road 20km x 30m
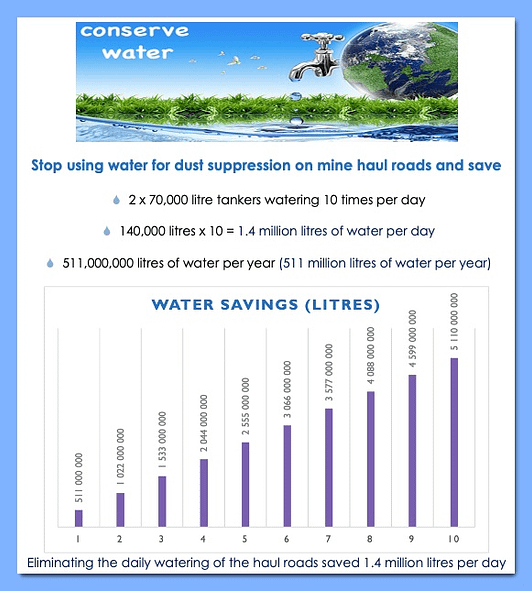
- Water Savings
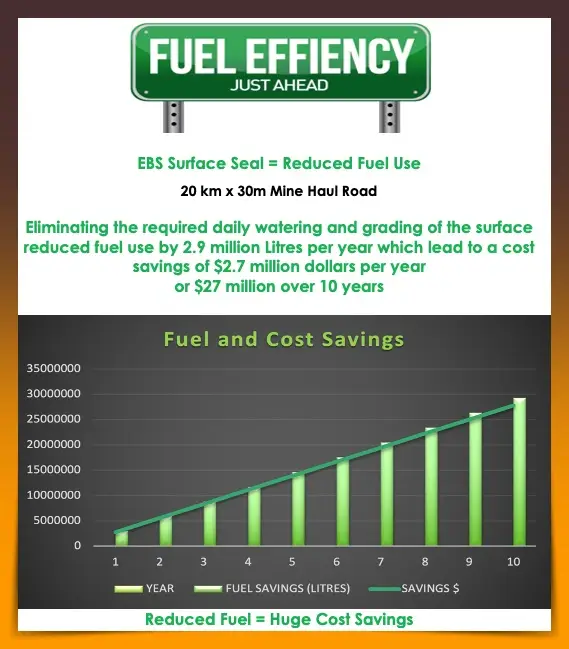
- Fuel & Savings
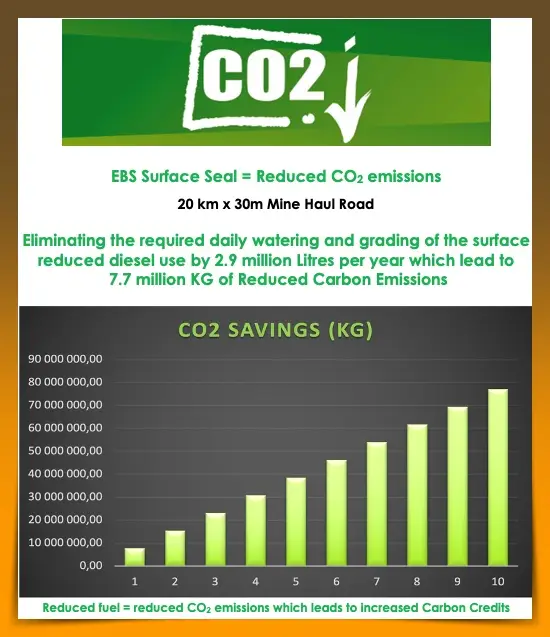
CO2 Savings
Cost Savings Comparisons
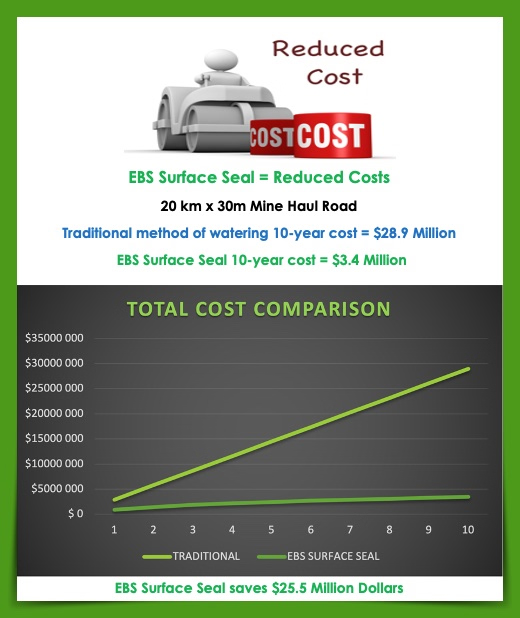
This is how we did it:
Based on the following: Haul Road Network: 20km x 30m = 600,000m2 Fleet
→ 2 x Cat 777F Water Trucks running 20 hours per day with an average diesel consumption of 82.4 litres per hour per vehicle
→ 20 x 82.4 = 1,648 x 2 = 3,296 litres of Diesel per day or 1,203,040 litres /year
→ 3 x CAT 16M Graders operating 12 hours per day with an average fuel consumption of 42.8 litres /hour
→ 36 x 42.8 = 1,540.8 litres per day or 562,392 litres/year
→ 20 x CAT 789 Haul Trucks running 20 hours per day with an average fuel consumption of 159 litres/hour which we improved by allowing a minimum of 5% which means a fuel savings of 7.95 litres per hour per vehicle due to decreased Rolling resistance as a direct result of an improved road surface.
Haul Fleet Fuel Savings per day = 3,180 litres
Haul Fleet Fuel Savings per year = 1,160,700 litres
Total Diesel Fuel Reduction: 2,926,132 litres (rounded to 2.9 million)
At a cost of Diesel of $.95 per litre this is a savings of $2,779,825.40
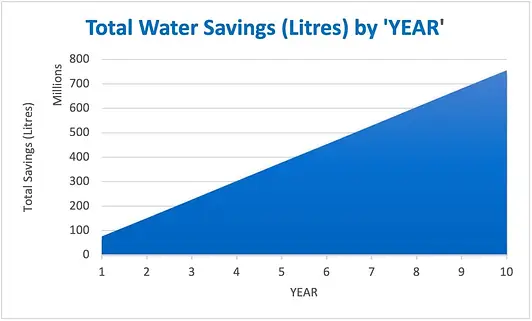
Water Savings
- 2 x 70,000 litre tankers watering 10 times per day
- 140,000 litres x 10 = 1.4 million litres of water per day
- 511,000,000 litres of water per year (511 million litres of water per year)
CO2 / Carbon Emission Reduction
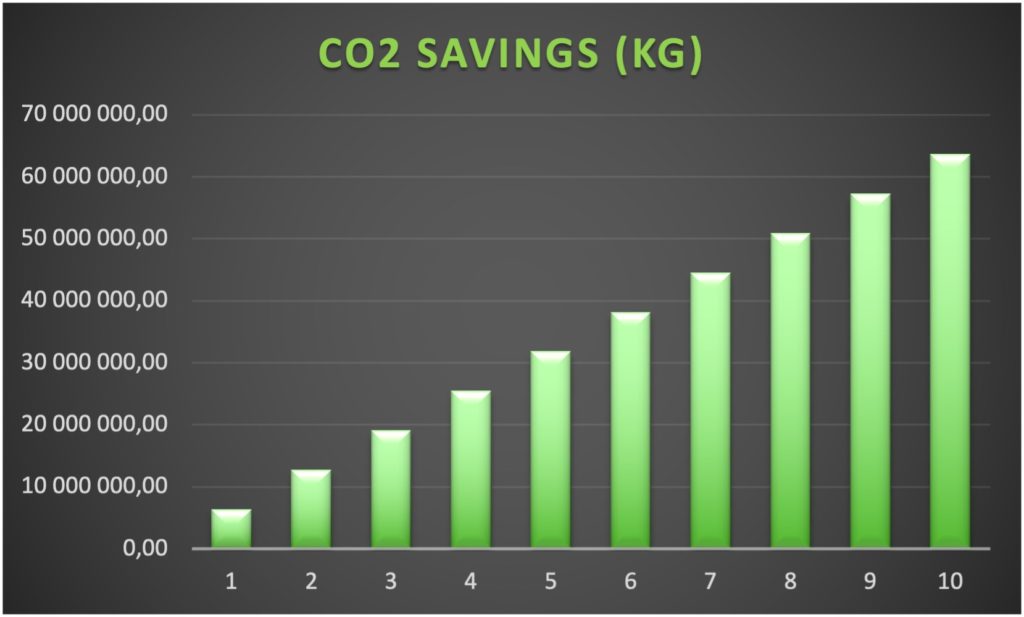
With a Diesel reduction of 2,926,132 litres per year x 2.63 = 7,695,727 kgs of CO2 emissions per year
Water cost of $.06 per m3 was used for a total of $30,660 per year
Water truck operating cost of $136.14 per hour was used (13.3 hours per day for 365 days per year) $1,326,877
Grading cost was based on $102.85 per hour x 3 graders (12 hours per day for 365 days per year $1,351,449
Wearing course remediation was based on $0.31 per m2 = $186,000
*Fuel consumption of vehicles based on an average taken from the Caterpillar Performance Handbook Version 47
- 3. Gravel Road 20km x 10m

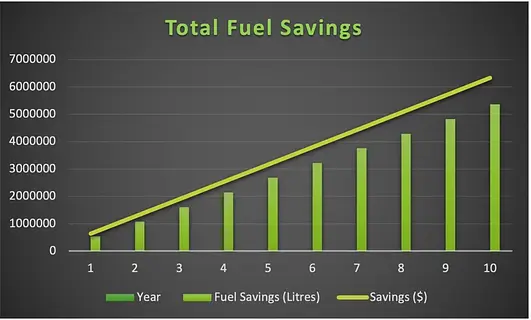
Fuel and Cost Savings – from the elimination of the watering, grading, and compaction of the road
Fuel Savings per day = 1,873 litres Fuel Savings per year = 536,265 litres
At a cost of Diesel of $1.18 per litre this is a savings of $632,792.70
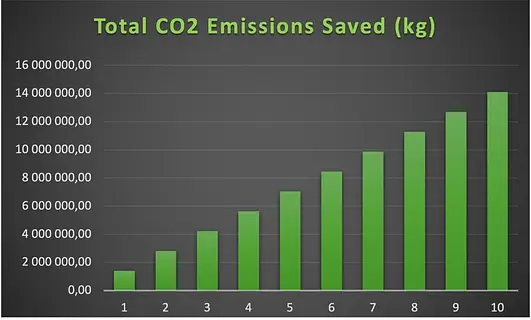
CO2 Savings
Due to a reduction in diesel of 536,265 litres / year – CO2 emissions reduced by 1.4 million kgs per year or 14 million kgs over a ten-year period.
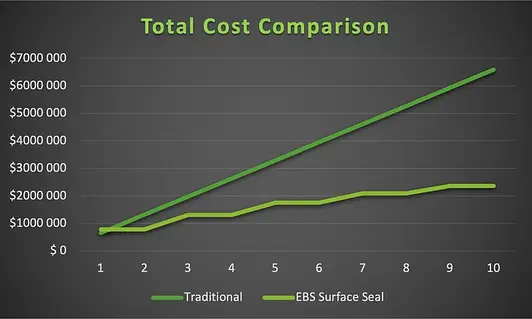
Cost Savings Comparisons
Traditional method of watering and grading = 10-year cost $6.5 million
EBS Surface Seal 10-year cost = $2.3 million
This is how we did it:
Based on the following: Road Network of 20km x 10m = 200,000m2
→ 4 x 18,000 litre Water Trucks running 9 hours per day for 350 days per year with an average diesel consumption of 40.6 litres per hour per truck
→ 4 x 40.6 x 9 = 1,461.6 litres of Diesel per day or 511,560 litres per year
→ 1 x Grader operating 9 hours per day for 60 days a year with an average fuel consumption of 26.75 litres per hour
→ 1 x 26.75 x 9 = 240.75 litres per day or 14,445 litres per year
→ 1 x Compactor/Roller operating 9 hours per day for 60 days a year with an average fuel consumption of 19 litres per hour
→ 1 x 19 x 9 = 171 litres per day or 10,260 litres per year
Fuel Savings per day = 1,873 litres Fuel Savings per year = 536,265 litres
At a cost of Diesel of $1.18 per litre this is a savings of $632,792.70
Water Savings
- 4 x 18,000 litre tankers watering 3 times per day
- 72,000 litres x 4 = 216,000 litres of water per day
- 75.6 million litres of water per year
CO2 / Carbon Emission Reduction
With a Diesel reduction of 536,265 litres per year x 2.63 = 1,410,377 kgs of CO2
emissions per year
Water truck operating costs estimated at $300 per day for 350 days per year = $420,000
Grader operating costs estimated at $450 per day for 60 days a year = $27,000
Compactor operating costs estimated at $200 per day for 60 days per year = $12,000
Wearing course remediation estimated at $1.00per m2 = $200,000
*Operating costs are estimated based on current rental prices
*Fuel consumption of vehicles based on an average taken from the Caterpillar Performance Handbook Version 47


